Demonstration · Illustrative data · BI Consulting Services
× BI Consulting Services

Workforce Outcomes Board — Portland Metro, from enrolment to a paycheque

One governed Power BI model for the WorkSource Portland Metro system: participants, placements, wages, credentials and WIOA funding burn — sliceable by county, funding stream and programme year, with the report-health strip your deployment pipeline would feed.

Prepared for Trace September 2026 Scope: Multnomah & Washington counties · City of Portland Tagline nod: “Because Work Matters”
Honest footnote first. It has been about 15 months since you chose another contractor for the permissions, deployment-pipeline and DAX work. No hard feelings — this page is simply what we would have built as a working starting point, so if that project ever needs a second pair of hands, you can see the shape of it in five minutes.

Monthly enrolments vs job placements

Selected period highlighted; prior months shown muted for context. Placements are counted in the quarter after exit, as in your annual report.

EnrolmentsPlacementsPlacement rate (right axis)

Participant journey

Enrolled → in training → credential → placed → retained 2 quarters

WorkSource Portland Metro — placements by centre

Marker area is proportional to placements in the selected filters. Centres are illustrative service points across the two-county area.

250 placements1,0002,000— Willamette / Columbia shown for orientation

Training completions by provider

Occupational-skills completions; bar = completions, tint = credential attainment rate

Funding stream burn vs allocation

Spend to date against programme-year allocation; the tick marks the straight-line expectation for the period.

What this board answers

Three questions a board member or a funder asks — answered from the current filter

Ask the data

Natural-language layer over the same governed model

Which centre has the biggest gap between training completions and placements?
Report health

The strip a deployment pipeline (Dev → Test → Prod) writes on every refresh — the part of the original ask around DAX and pipelines.

Demonstration · Illustrative data · BI Consulting Services
Also from BI Consulting Services

Private AI on your own server

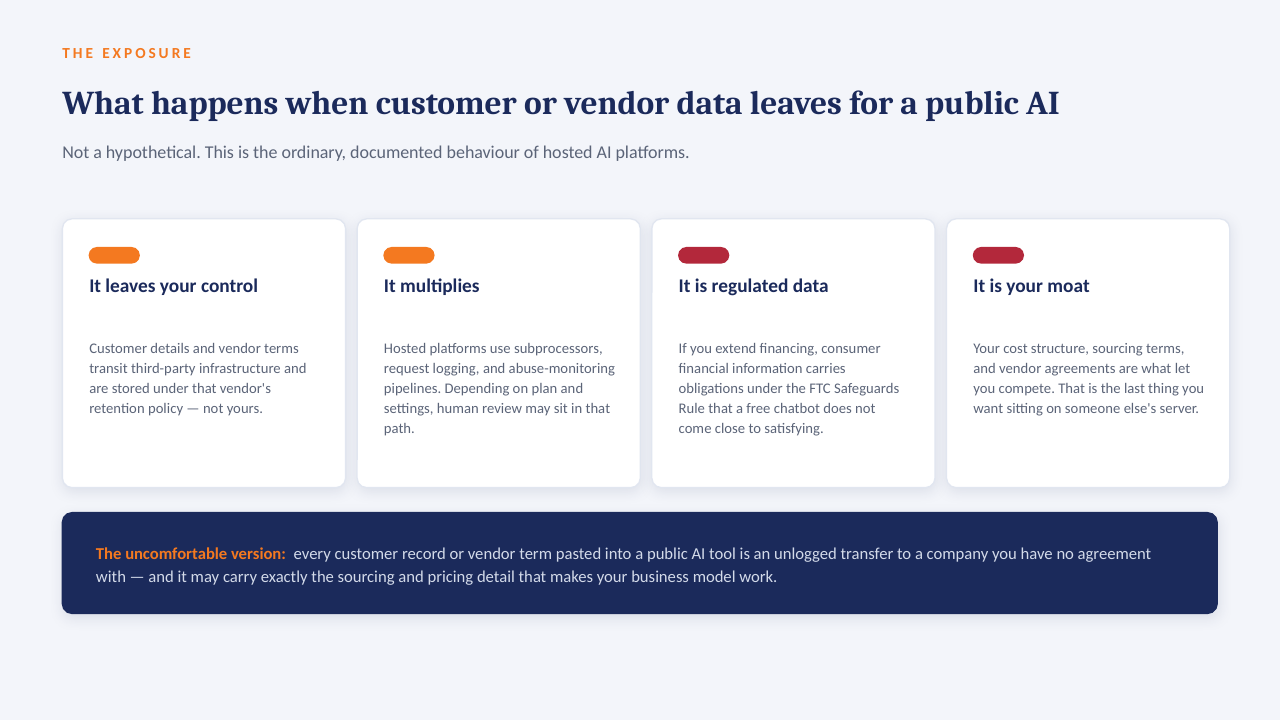
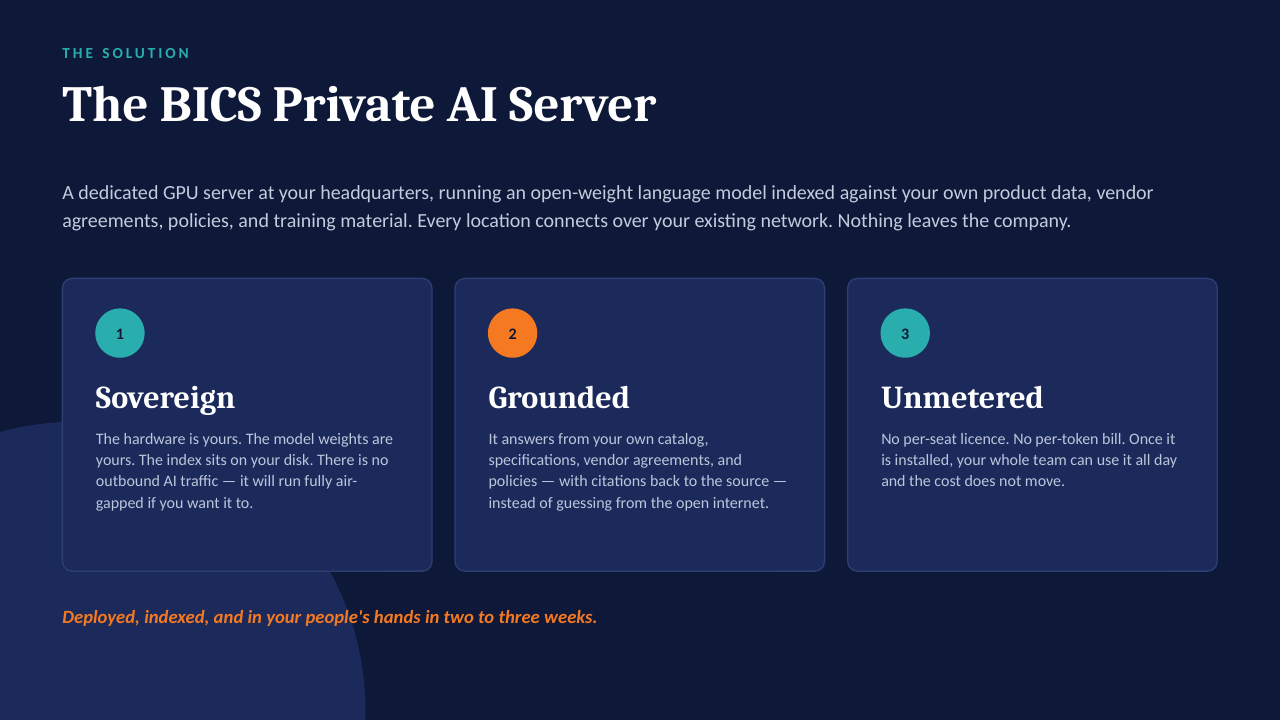
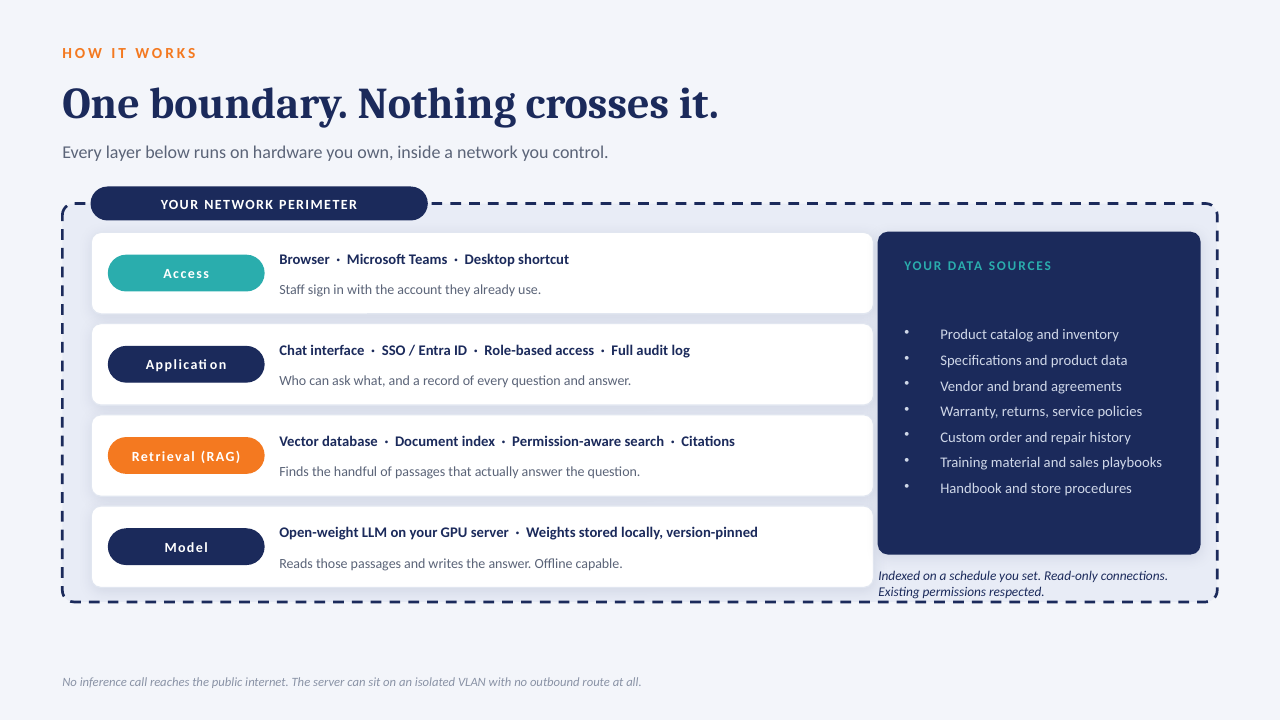
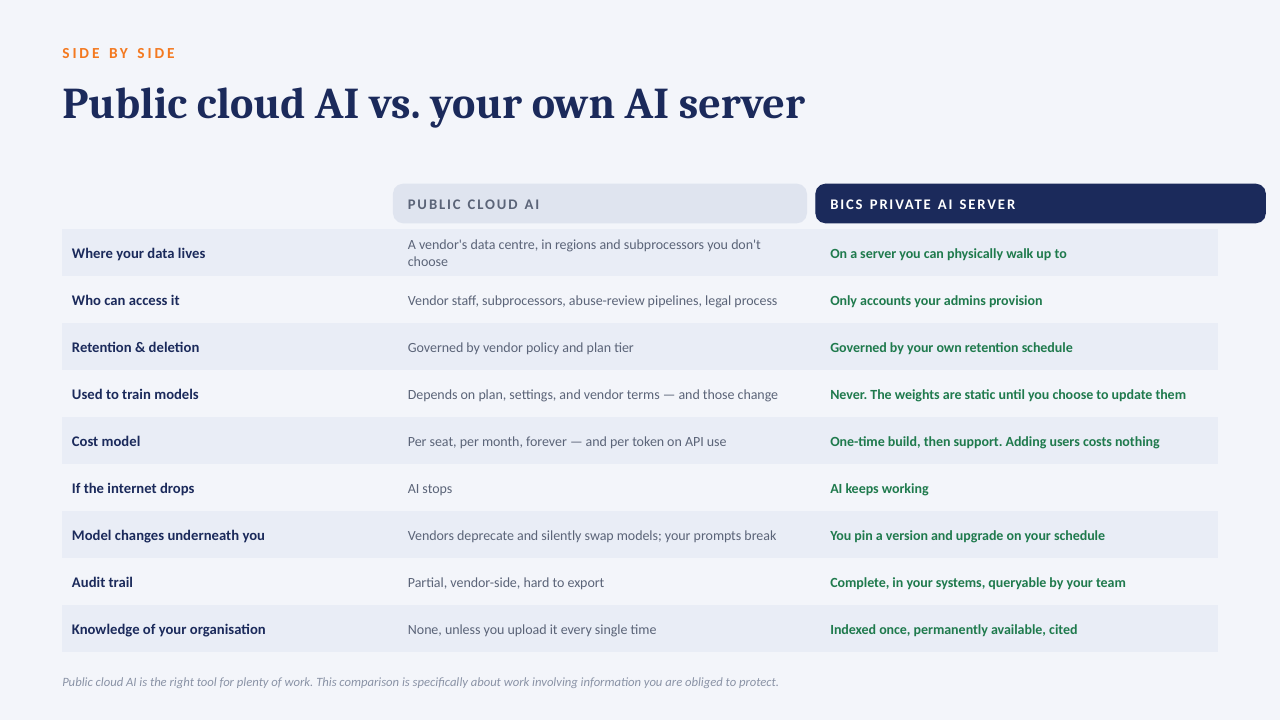
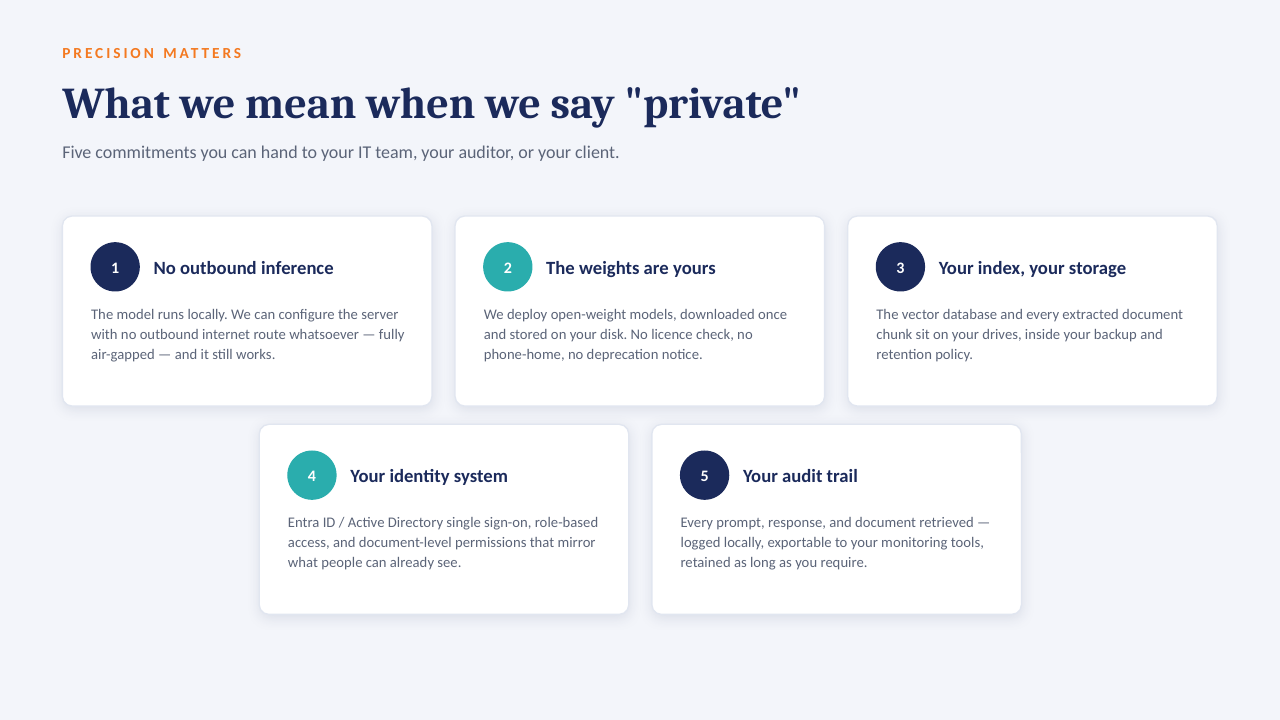
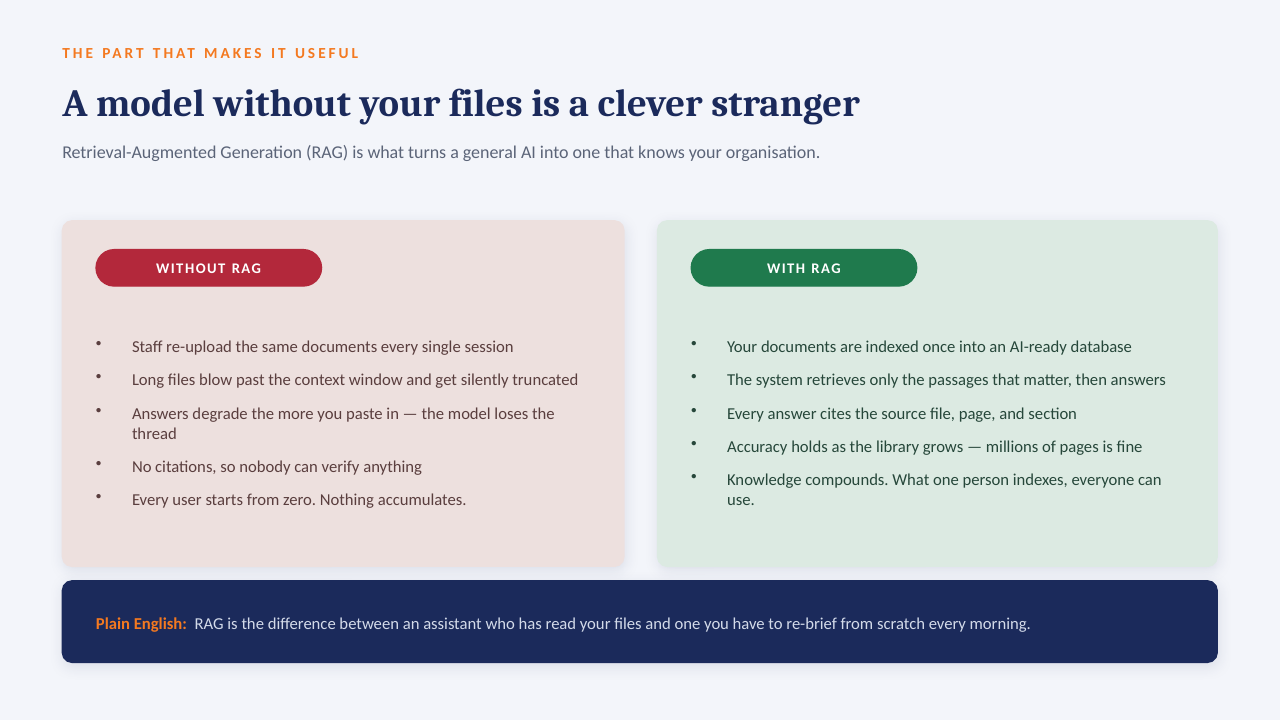
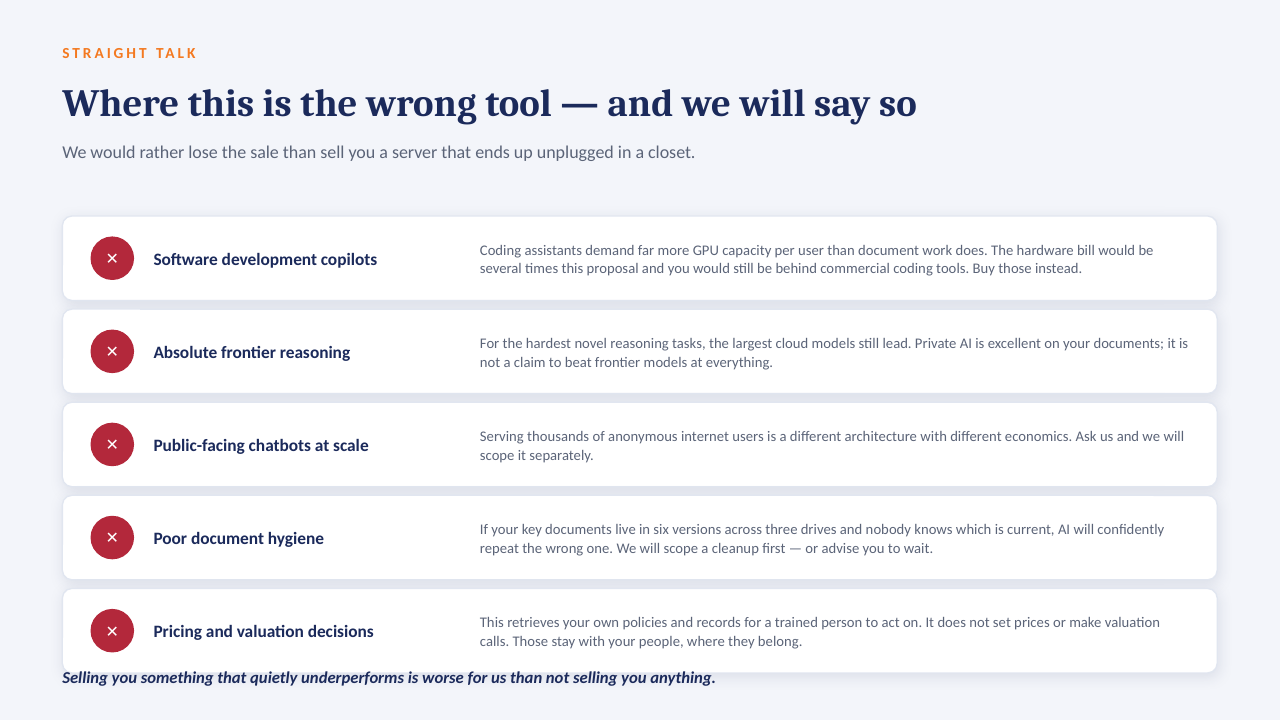
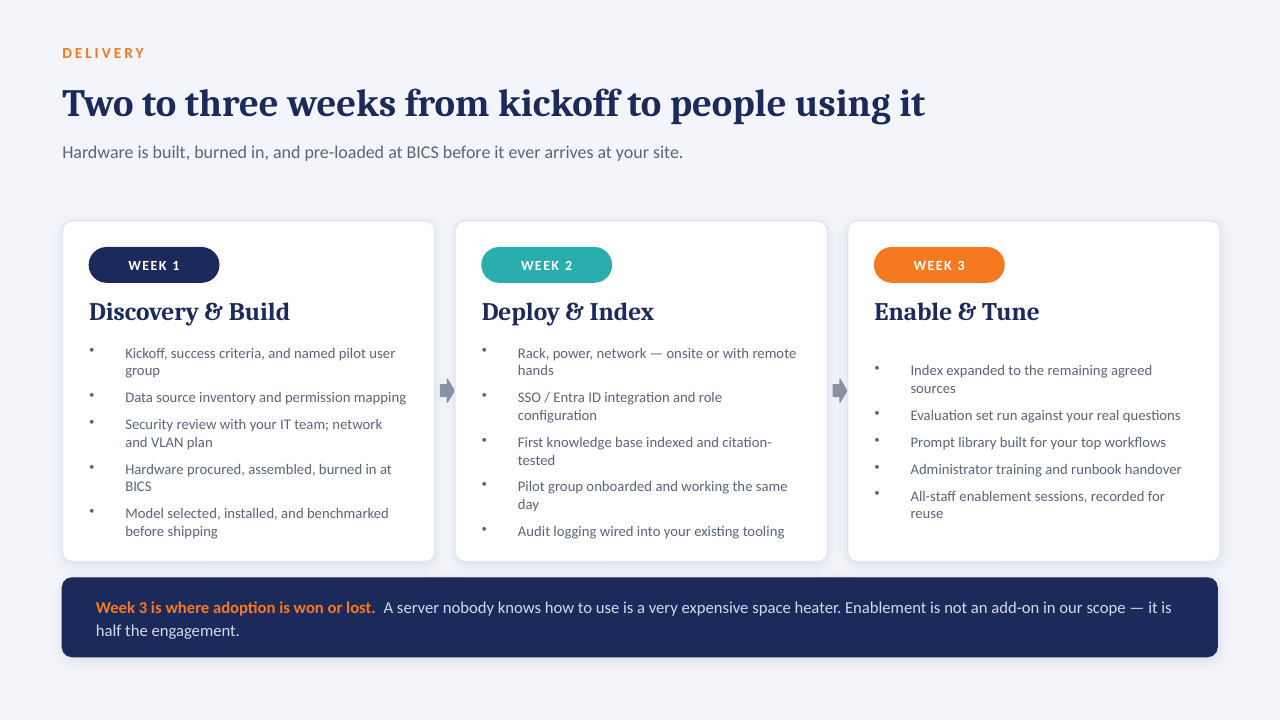
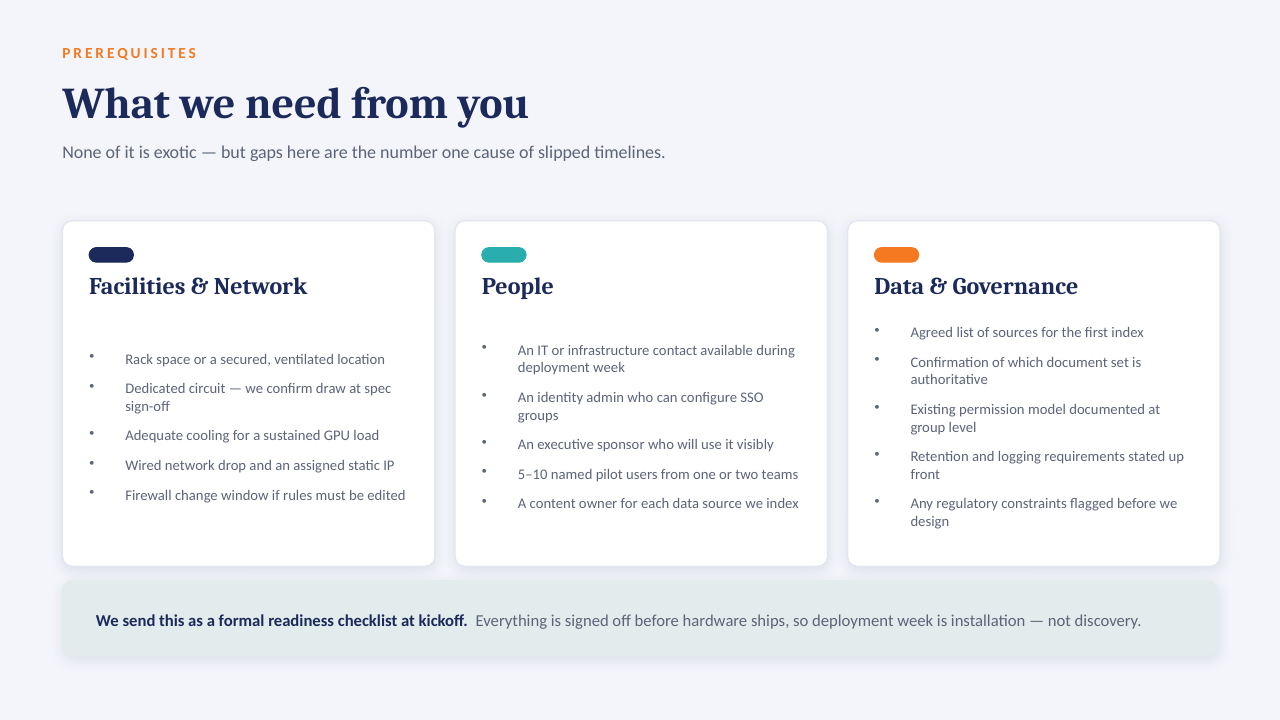
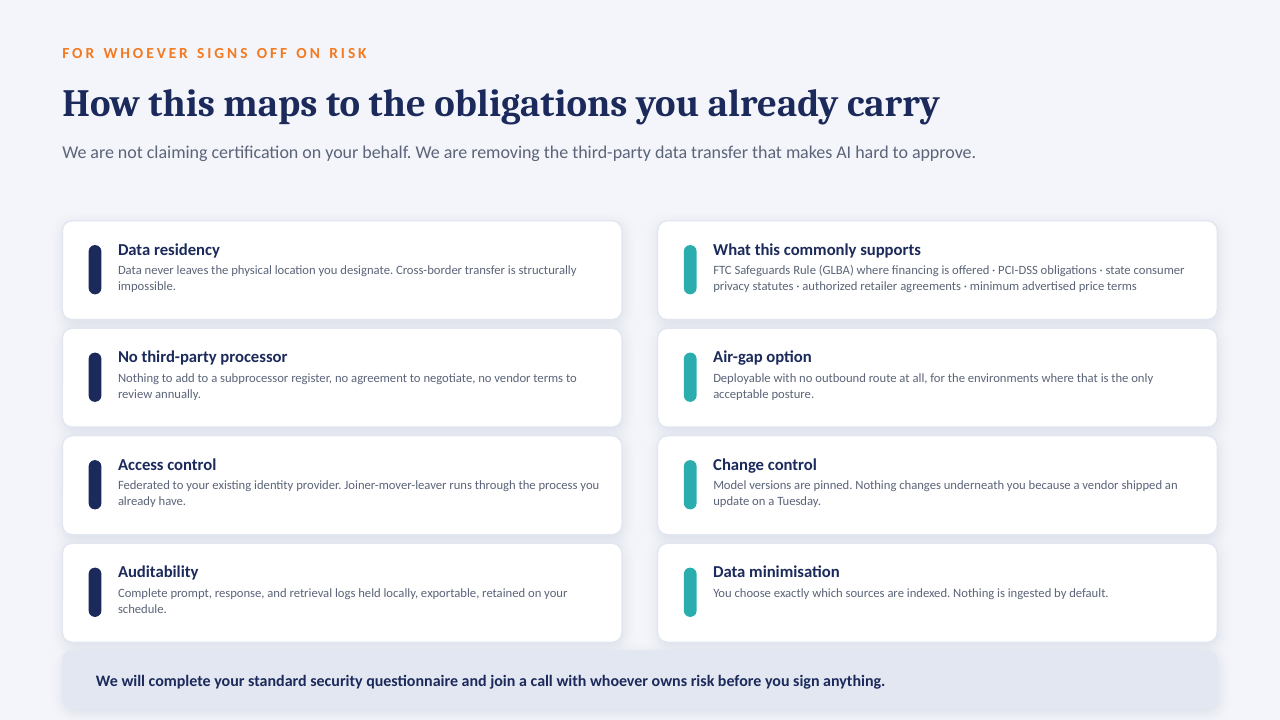
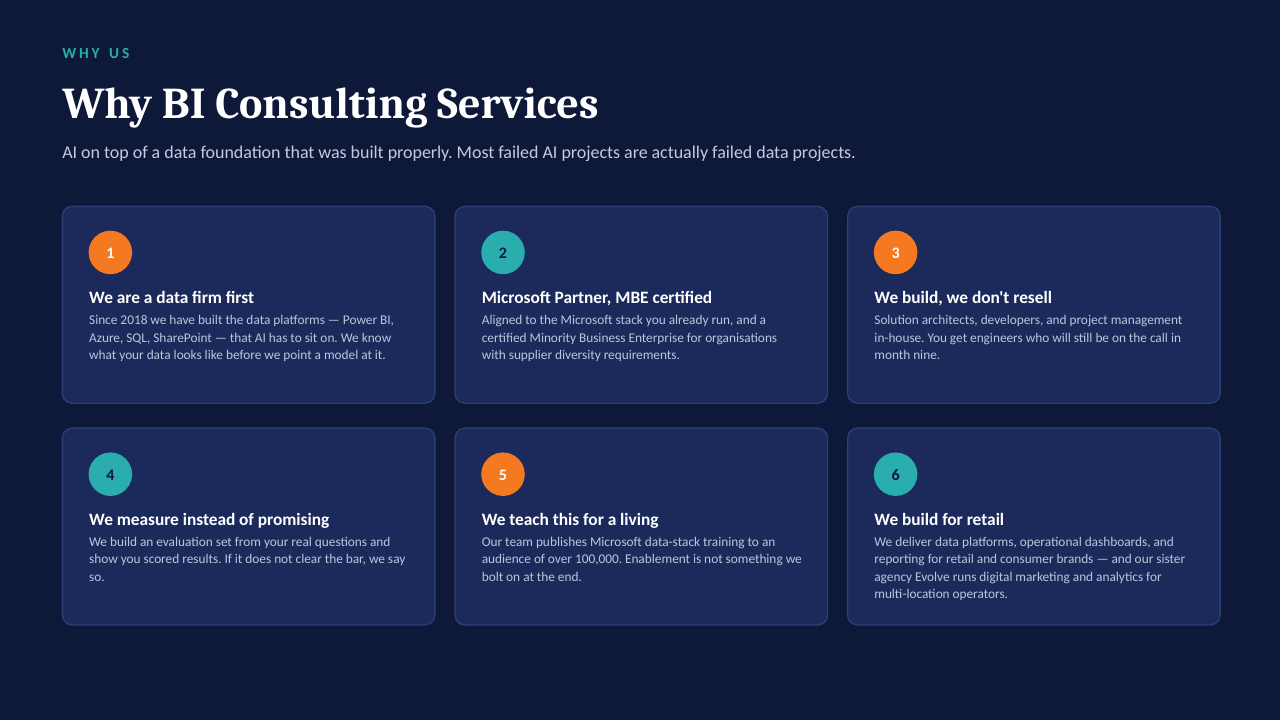
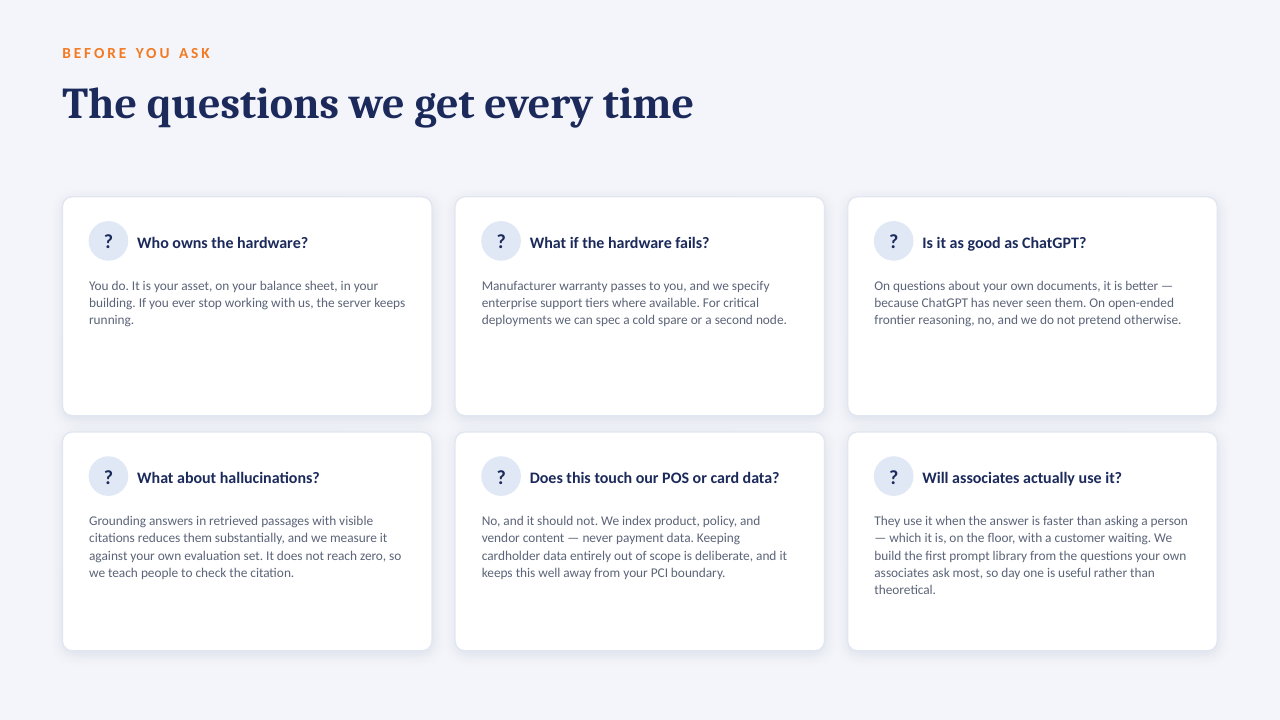
The "ask the data" ideas on this board are designed to run on a GPU server inside your own network — an open-weight model over your own documents, cited answers, no per-seat licence, nothing leaving the building. The short deck below explains how it works. Scroll through, or download it as a PDF.

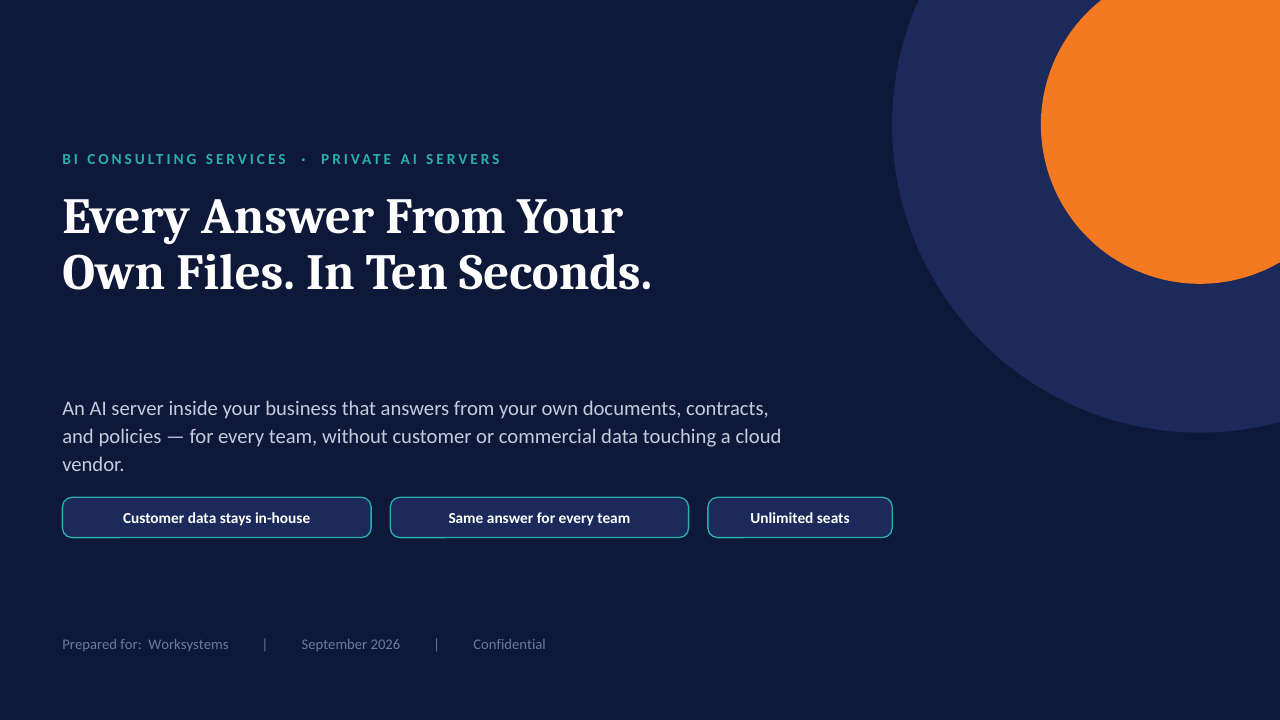
Private AI Servers — slide 1 of 14
Private AI Servers — slide 2 of 14
Private AI Servers — slide 3 of 14
Private AI Servers — slide 4 of 14
Private AI Servers — slide 5 of 14
Private AI Servers — slide 6 of 14
Private AI Servers — slide 7 of 14
Private AI Servers — slide 8 of 14
Private AI Servers — slide 9 of 14
Private AI Servers — slide 10 of 14
Private AI Servers — slide 11 of 14
Private AI Servers — slide 12 of 14
Private AI Servers — slide 13 of 14
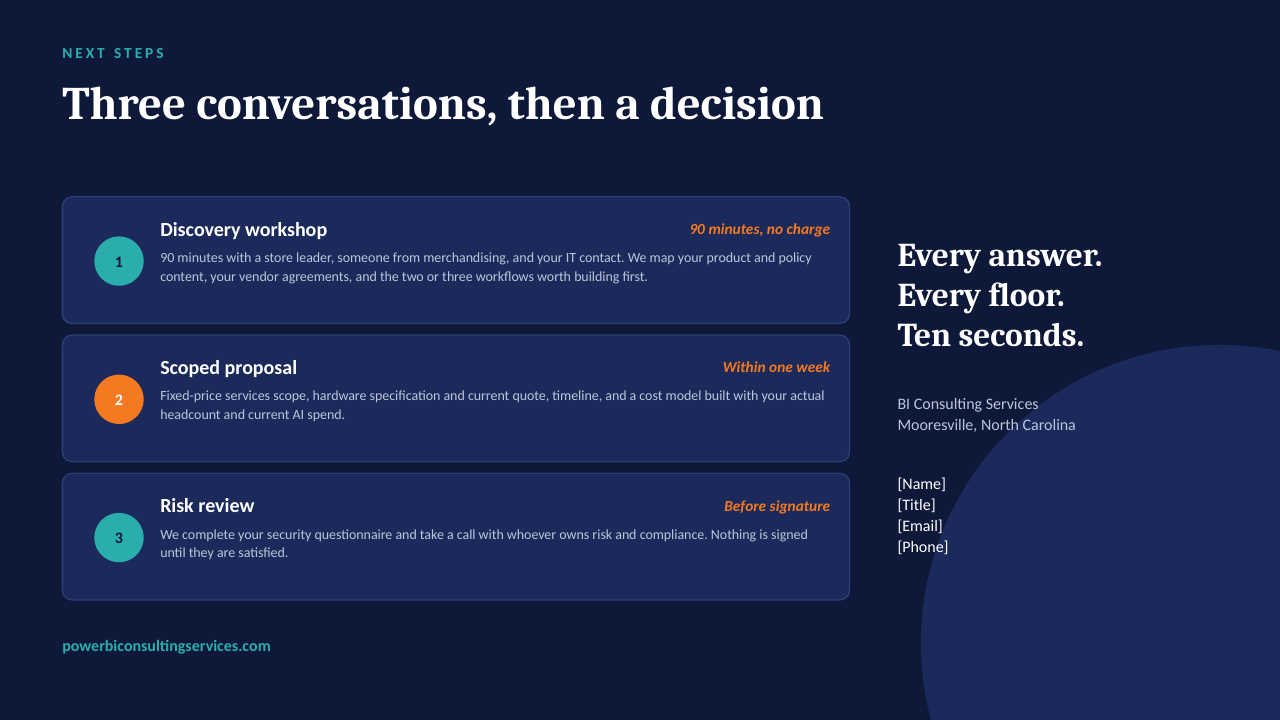
Private AI Servers — slide 14 of 14

Questions? Book 30 minutes: calendly.com/powerbiconsultingservices/30min